Colormaps
Although the choice of a colormap is to a large degree arbitrary, it can be in some cases difficult to obtain a suitable colormap for a certain task. We have found it in particular difficult to obtain a suitable colormap for the visualization of orientations and phase angles. For this purpose, we have listed our personal choices for a specific coloring here. Note, that these functions have been written by other authors. We rely on the Matlab software packages written by Matteo Niccoli (https://de.mathworks.com/matlabcentral/fileexchange/28982-perceptually-improved-colormaps), Matthias Geissbuehler (https://de.mathworks.com/matlabcentral/fileexchange/31761-colormaps-compatible-with-red-green-color-perception-deficiencies), and Peter Kovesi (https://peterkovesi.com/projects/colourmaps/index.html). See the links for more information on the specific use of each package. The Matlab implementations can be found in /colormaps/.
Visualizing phase angles
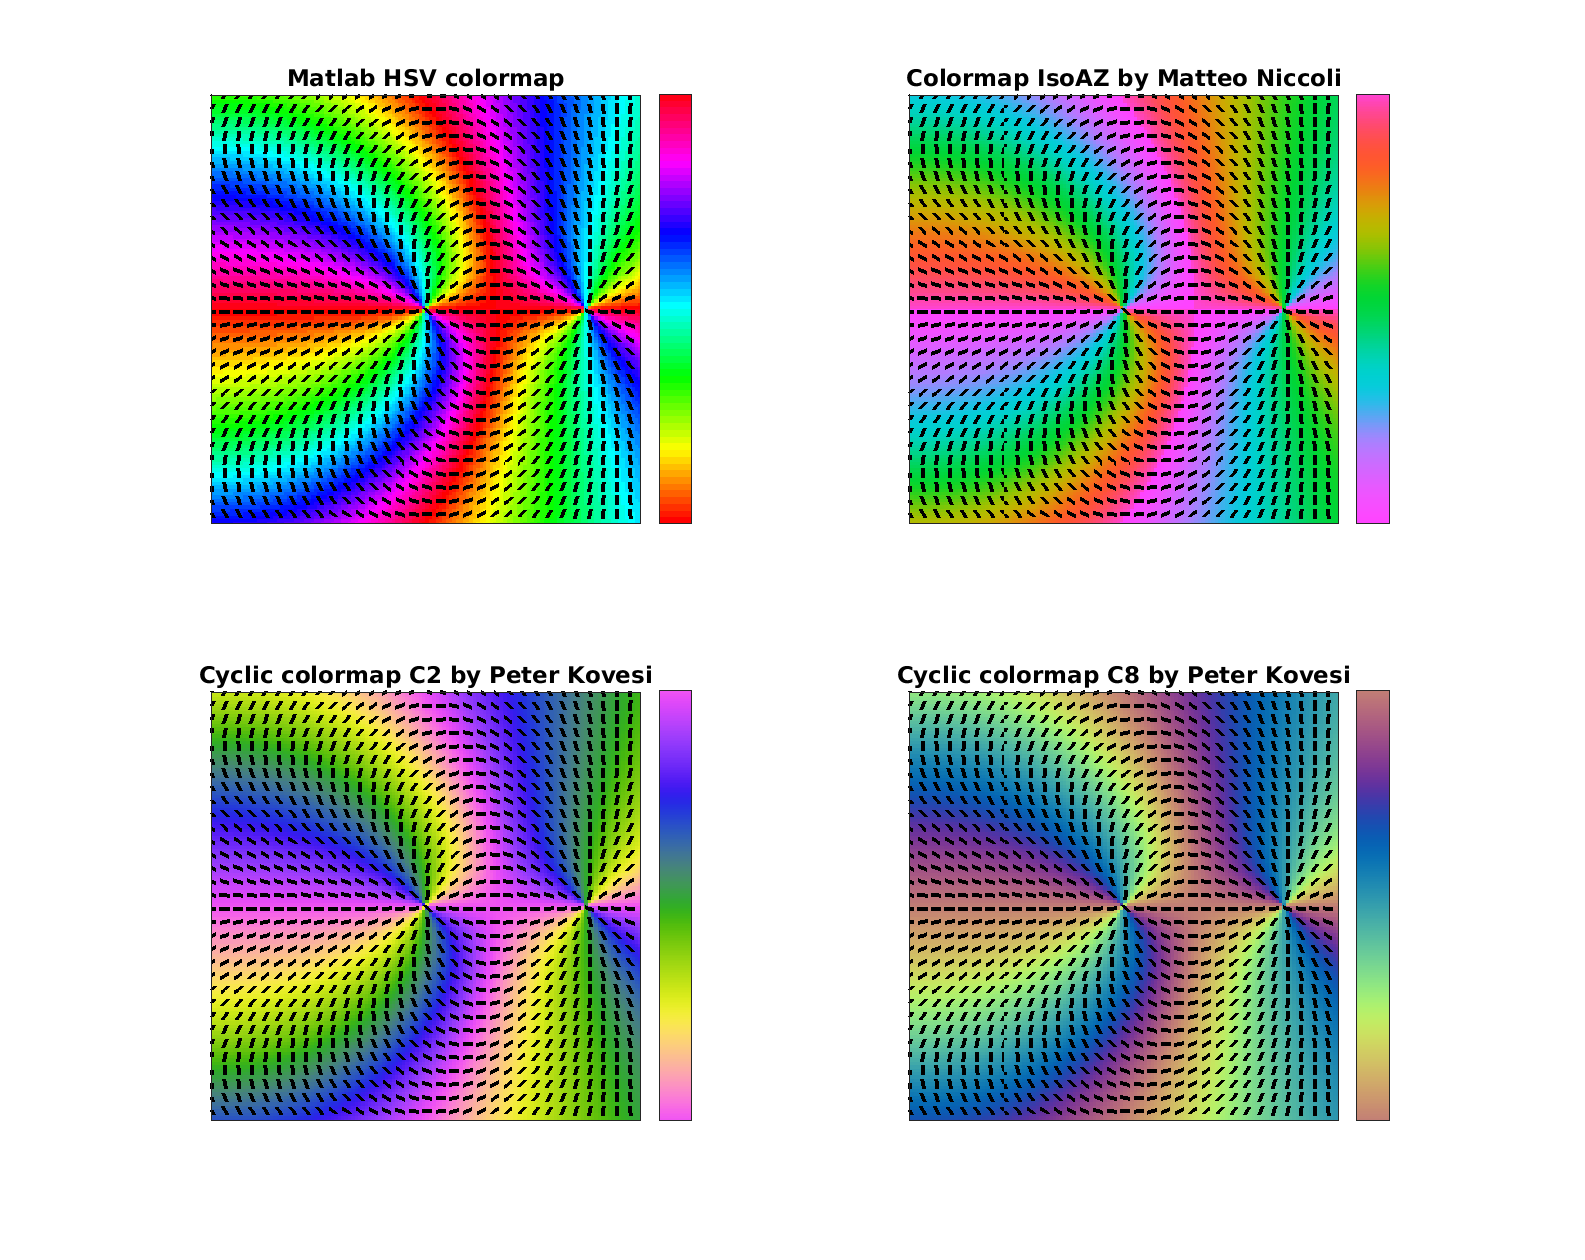
Phase angles are challenging to implement. We found the colormaps C2 and C8 implemented by Peter Kovesi to be especially smooth and eye-friendly. For a comparison with the standard Matlab colormap HSV, see the figure below. Note, that arrows have been added, as should usually be done since phase color maps can be challenging to interpret for colorblind individuals. The nanodiffraction toolbox offers the function add_quiver as part of the visualization module for this purpose.
Visualizing scattering maps
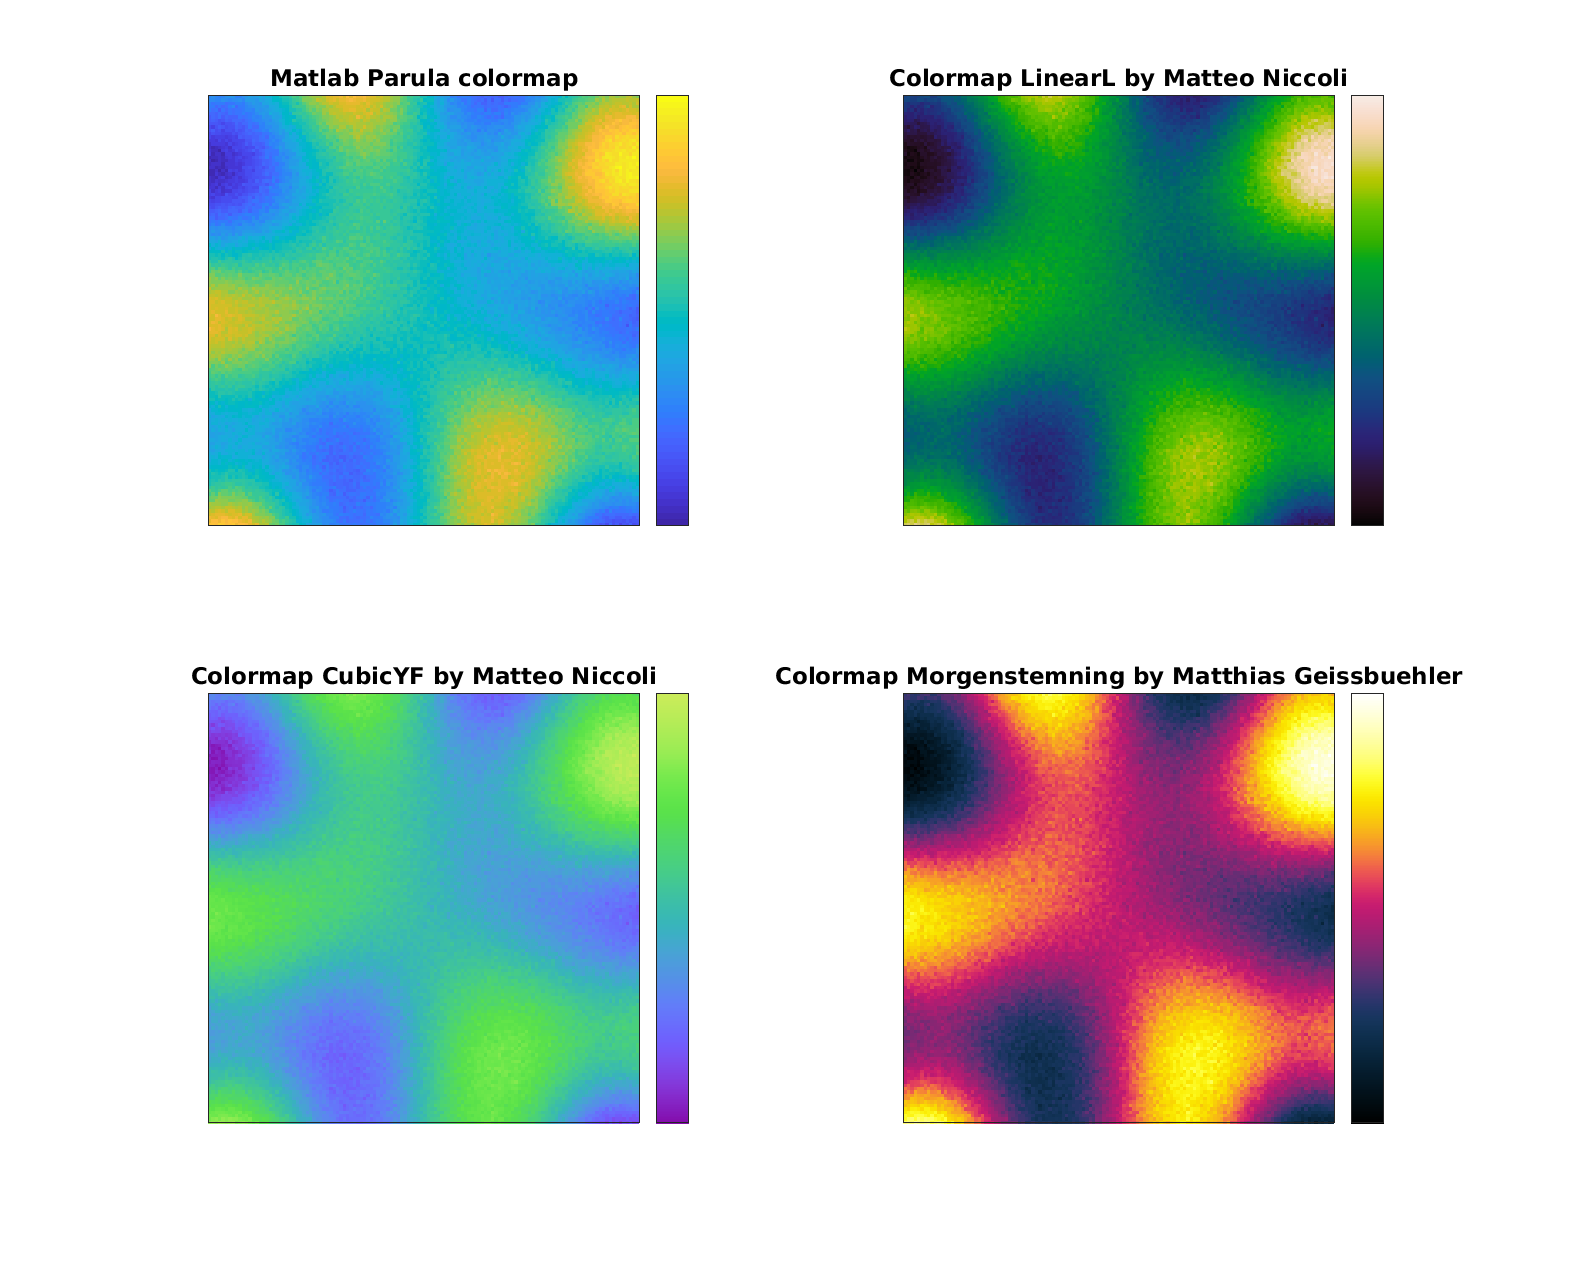
There is a wide variety of suitable colormaps available for linear color scaling. The nanodiffraction toolbox offers two color schemes, the CubicYF colormap by Matteo Niccoli as well as the Matlab standard grayscale colormap. Maps of structure parameters are usually colored using the CubicYF colormap, while diffraction data is colored in gray. There are, however, other highly suited colormaps available, such as LinearL by Matteo Niccoli and Morgenstemning by Matthias Geissbuehler, see the Figure below.

The LinearL and CubicYF colormaps by Peter Kovesi and Morgenstemning by Matthias Geissbuehler are especially well suited for the coloring of scattering maps. The nanodiffraction toolbox uses CubicYF by default.
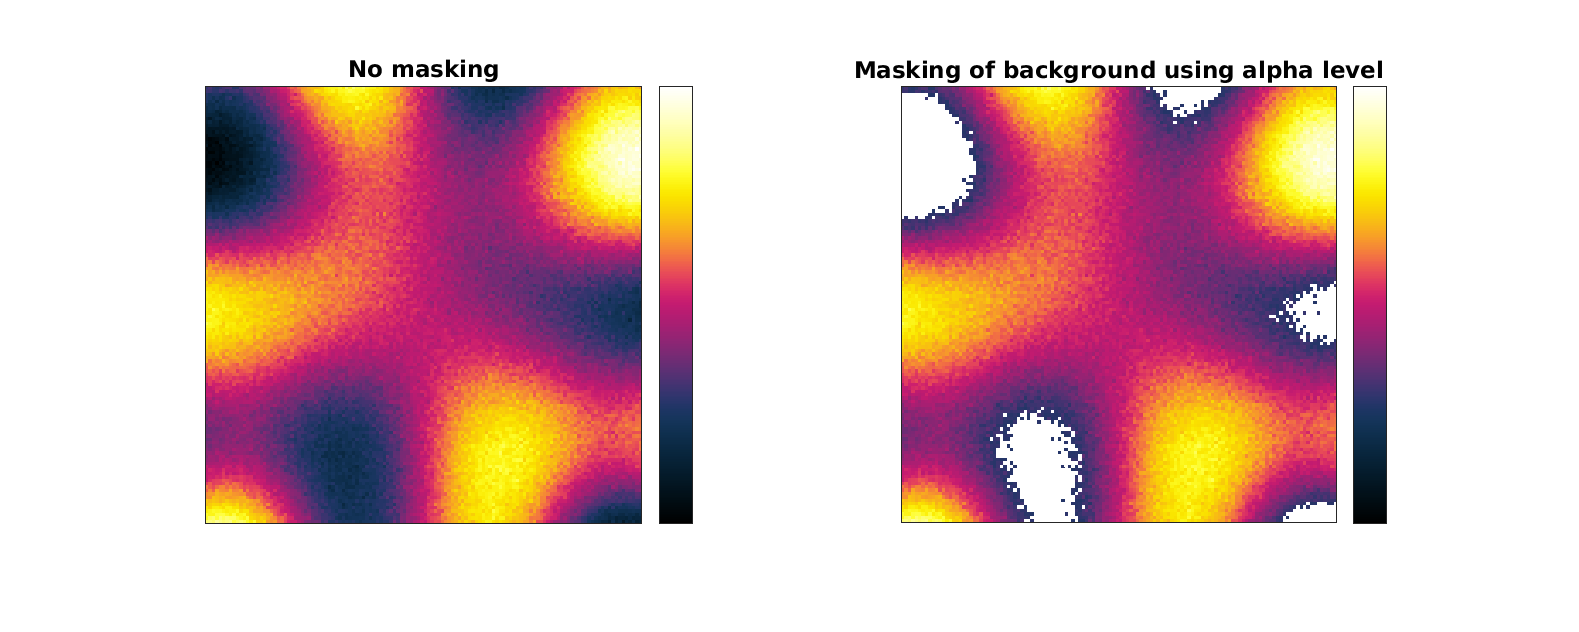
Note, that a dark background can lead to a lot of toner being used when printed. To remove unnecessary background, all scan points/pixels from background regions can be colored in white. This is implemented in the functions pca and stxm (of the display module) as the alpha parameter. One example is shown below:

